

For anyone involved in hydrogeological surveys or groundwater well drilling, a geophysical water finder is one of the most valuable tools in the field. Many users, however, struggle when they first start-too many parameters, unclear steps, inaccurate profiles, or inconsistent results that lead to wasted drilling costs.
The truth is this: using a water-finding instrument is not complicated once you understand how it works and how to operate it correctly. In this guide, we walk through the core principles, field techniques, interpretation methods, and advanced skills based on real field experience. Our goal is to help you improve groundwater detection accuracy and avoid common mistakes.
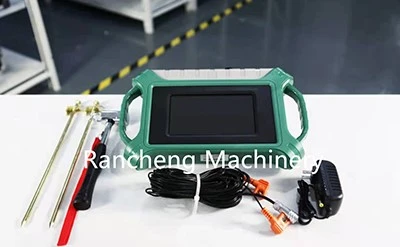
How a Water Finder Works
Most water-finding instruments on the market rely on the natural telluric (earth) electric field as a signal source. Different frequencies of electromagnetic energy penetrate the ground to different depths-high frequencies penetrate shallow layers, while low frequencies reach deeper zones. By measuring the variation of these natural signals on the surface, the instrument calculates the subsurface resistivity structure and identifies potential water-bearing zones.
Two theoretical foundations guide this process:
- Helmholtz equations, which describe how electromagnetic fields propagate underground
- The relationship between electromagnetic waves and resistivity allows penetration depth (skin-depth) calculations
Since electromagnetic waves attenuate during propagation, the attenuation coefficient must also be considered when interpreting results.
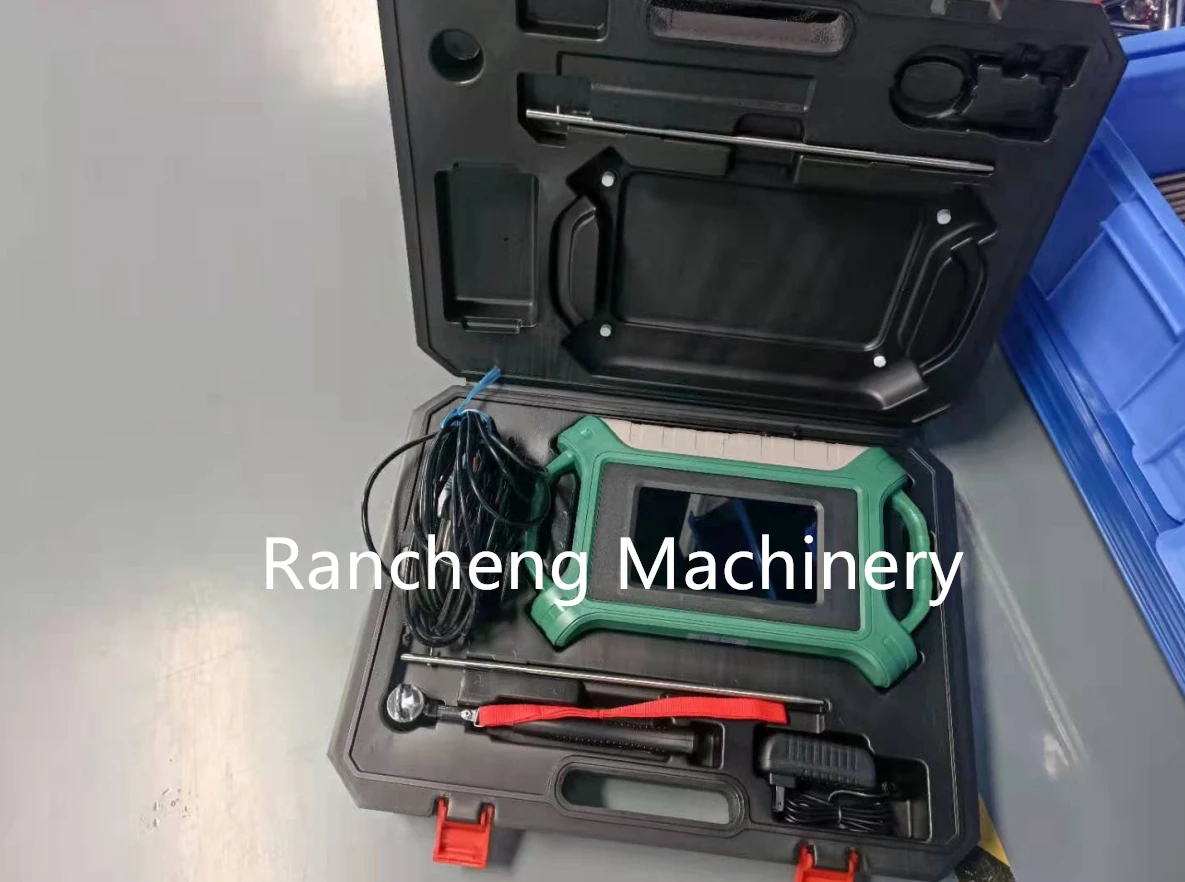
Basic Operation Methods
There are two standard measurement approaches:
• MN Electrodes
Two ground electrodes (M and N) placed 5–10 m apart (up to 20 m). The instrument measures the natural electric field between them.
• Electromagnetic Probe
A portable sensor that directly measures the electromagnetic field and converts it into resistivity.
Regardless of the method, collecting multiple points along a survey line is essential. More points generate clearer 2D profiles, and advanced instruments can even provide 3D imaging to visualize subsurface layers.
Survey Line Layout & Key Parameters
Choosing the Right Line Direction
Survey lines should be as straight as possible. Ideally, the line direction should be perpendicular to the groundwater recharge direction. If the groundwater flows east-to-west, then the survey line should run north-to-south.
If the recharge direction is unknown, simply choose a flat area and lay out a straight line. Avoid electrical interference sources such as power lines, machinery, or buried pipelines.
How Many Measurement Points Are Enough?
Many beginners measure only six points and stop once the instrument displays a color image. This is a major mistake. Too few points lead to misleading results.
We recommend at least 14 points per line, more if possible. The denser the data, the more accurate the interpretation.
Spacing Parameters
• MN spacing (electrode distance): 5–20 m
Short spacing leads to weak signals and more interference.
• Point spacing: 1–5 m
For fracture water or domestic wells: ~2 m
For large aquifers or irrigation wells: 5–10 m
Large plains can use bigger spacing; mountainous areas require smaller spacing
• Line spacing:
Never rely on just one profile. At least three parallel lines help determine the aquifer scale, continuity, and recharge direction.

Avoiding Interference During Measurement
Interference comes from natural and artificial sources: unstable natural electric fields, high-voltage lines, radio towers, trucks, construction machinery, or buried metal.
Here's how to reduce errors:
• High-voltage or overhead power lines
Keep at least 50 m away
Align survey lines parallel to power lines
Repeat each point twice to verify consistency
• Construction machinery or traffic
Request a pause if possible. If not, measure affected points twice and mark them for later analysis.
• Hard ground: concrete, rock, or dry sand
MN electrodes may produce unstable readings. Switch to an electromagnetic probe, which performs better on high-resistance terrain.
• Heavy interference that cannot be avoided
Use a multi-channel system, allowing simultaneous multi-frequency data to separate geological signals from noise.

How to Read the Profile and Make Correct Judgments
A resistivity profile is valuable only when it is interpreted with context. Many users rely solely on colors, which often causes misjudgment. A correct reading usually involves two connected steps: understanding the measurement background and combining the color information with local geological conditions.
1. Start With the Measurement Context
Before opening the profile, take a moment to confirm how the data was collected. This affects every interpretation that follows.
Key considerations include:
• Survey mode - Was the measurement done with an electromagnetic probe or MN electrodes?
Different methods respond differently to noise, terrain, and shallow structures.
• Point spacing and line spacing - Wide spacing smooths details, while dense spacing reveals small fracture zones or thin aquifers.
• Geological target - Are you looking for bedrock fractures, Quaternary sediments, or a combination?
A "blue anomaly" in fractured rock means something completely different from a blue zone in a clay-covered plain.
Understanding these basic conditions ensures that the colors you see are placed in the correct geological framework.
2. Combine Colors With Real Geology
In most instruments, blue or cool colors represent relatively low resistivity. However, "low resistivity" is not equal to "confirmed water." It can also reflect:
• clay layers
• weathered materials
• weakly compacted sediments
On the other hand, some productive gravel aquifers may appear yellow or green, because gravels can be porous yet moderately resistive.
To judge whether a low-resistivity zone truly represents groundwater, compare the color pattern with:
• local hydrogeological knowledge
• nearby well records
• known fracture or fault trends
• landform features such as valleys, slopes, or alluvial fans
Only when a low-resistivity zone aligns with favorable geological structures can it be considered a reliable water-bearing target.
Common Problems and Practical Solutions
Many issues encountered during field surveys become easy to explain once we understand how resistivity behaves in real geological environments.
1. Why do some blue zones contain water while others do not
A blue area simply indicates that its resistivity is lower relative to surrounding formations. This color may appear in wet soil, clay-rich horizons, weathered layers, or saturated sediments. Whether a blue area represents a usable aquifer depends on its permeability, thickness, and structural relationship to nearby fractures or channels. Color alone cannot confirm water; it must be interpreted together with geological context.
2. Why a known water-producing well may show no anomaly on the profile
Existing wells can alter the resistivity field around them. Drilling mud may remain along the borehole wall, steel casing can distort current flow, and groundwater around the well may be locally disturbed. These effects often hide or weaken the signature of the actual aquifer. A practical solution is to shift the survey line slightly away from the well or increase the electrode spacing so that the instrument captures the undisturbed formation.
3. Why repeated surveys may produce different results
Different profiles often result from inconsistent acquisition conditions. A change in line direction, point spacing, or electrode spacing will naturally reshape the imaging result. Unexpected interference such as nearby machinery, vehicle movement, or new power lines can also distort signals. If these factors vary between measurements, the two profiles will not match-even when the geology is unchanged.
4. Whether surveys can be done after rain
For natural-field instruments, light rain usually does not cause serious problems because the system observes naturally occurring electromagnetic signals. As long as the ground is not heavily flooded, measurements remain usable.
For artificial-field instruments, however, rain introduces a significant challenge: wet ground creates a conductive film that redirects current, reduces apparent resistivity, and shifts depth readings. In such cases, the results can be misleading until the surface dries.
5. How to choose between electromagnetic probes and wireless stick-type instruments
Wireless stick-type devices are highly portable and excellent for small-area rapid surveys or initial reconnaissance. For large-scale profiling-especially where stability and data consistency are critical-wired electromagnetic probes are generally more reliable because they maintain stronger signal coupling and are less affected by environmental disturbances.

Advanced Techniques to Improve Success Rates
These practical methods significantly increase the reliability of groundwater interpretation.
1. Cross-Line Verification
Measure at least three parallel lines plus one perpendicular line.
If all lines repeat the same anomaly, the structure is reliable and continuous.
2. Circular Surveys for Local Water Searching
In mountainous villages or small basins, a circular measurement pattern helps determine whether groundwater converges toward a central point.
3. Dense Single-Point Refinement
After identifying a promising zone, reduce spacing to around 1 m.
This helps pinpoint the most accurate drilling position and improves well success.
4. Multi-Channel Data Acquisition
Multi-channel systems record multiple frequencies simultaneously.
This reduces the influence of unstable natural fields and produces a clearer, more consistent profile.
Estimating Water Yield and Understanding Recharge Direction
Water yield cannot be calculated directly from a resistivity profile. The image only reflects the electrical structure of the subsurface, while actual yield depends on the combined influence of aquifer thickness, permeability, and the strength of local recharge. A low-resistivity zone may indicate saturation, but the ability to supply stable water is controlled by how well the formation transmits and replenishes groundwater. Therefore, yield judgment should always reference nearby well data, pumping results, and regional geological comparisons rather than relying on profile colors alone.
Determining recharge direction requires observing how the aquifer geometry changes across several parallel lines. When an aquifer becomes progressively shallower, wider, or shows a consistent decrease in resistivity toward one side, it usually suggests that groundwater is migrating from that direction. These changes reflect the natural gradient and the convergence of water-bearing structures. This approach is especially effective in plains, alluvial fan environments, and fracture-controlled terrains where lateral continuity allows clear comparison between multiple profiles.
A water-finding instrument provides valuable insight, but it requires correct operation and geological reasoning to achieve accurate results. By understanding the measurement method, reading the profile in context, and applying practical field techniques, users can significantly increase drilling success and reduce survey cost.
If you need assistance selecting the right natural-field or multi-channel instrument for domestic wells, irrigation projects, or industrial groundwater surveys, we can recommend suitable models based on your geology and budget.


